ECharts 文本样式
在 ECharts 图表中除了核心的各式各样的图表,剩下的应该就是那些文本文字了,文字的描述也是直接关系到整个图表的意义,文字的样式有同样决定了图表的美观程度,优秀的图表类型选择加上合适的文本样式才能组成最漂亮的图表。这个小节我们就从各个方面去看一下如何对图表中的文本进行美化吧。
1. 简介
在 ECharts 的各个组件、图表中,充斥着许多与文本相关的配置,比如 title 组件的 textStyle、subTextStyle 属性; legend 组件的 textStyle 属性;line 图表的 label 属性等等。可以说,但凡与文本有关的功能,都可以参考本文的配置说明。
2. 配置项
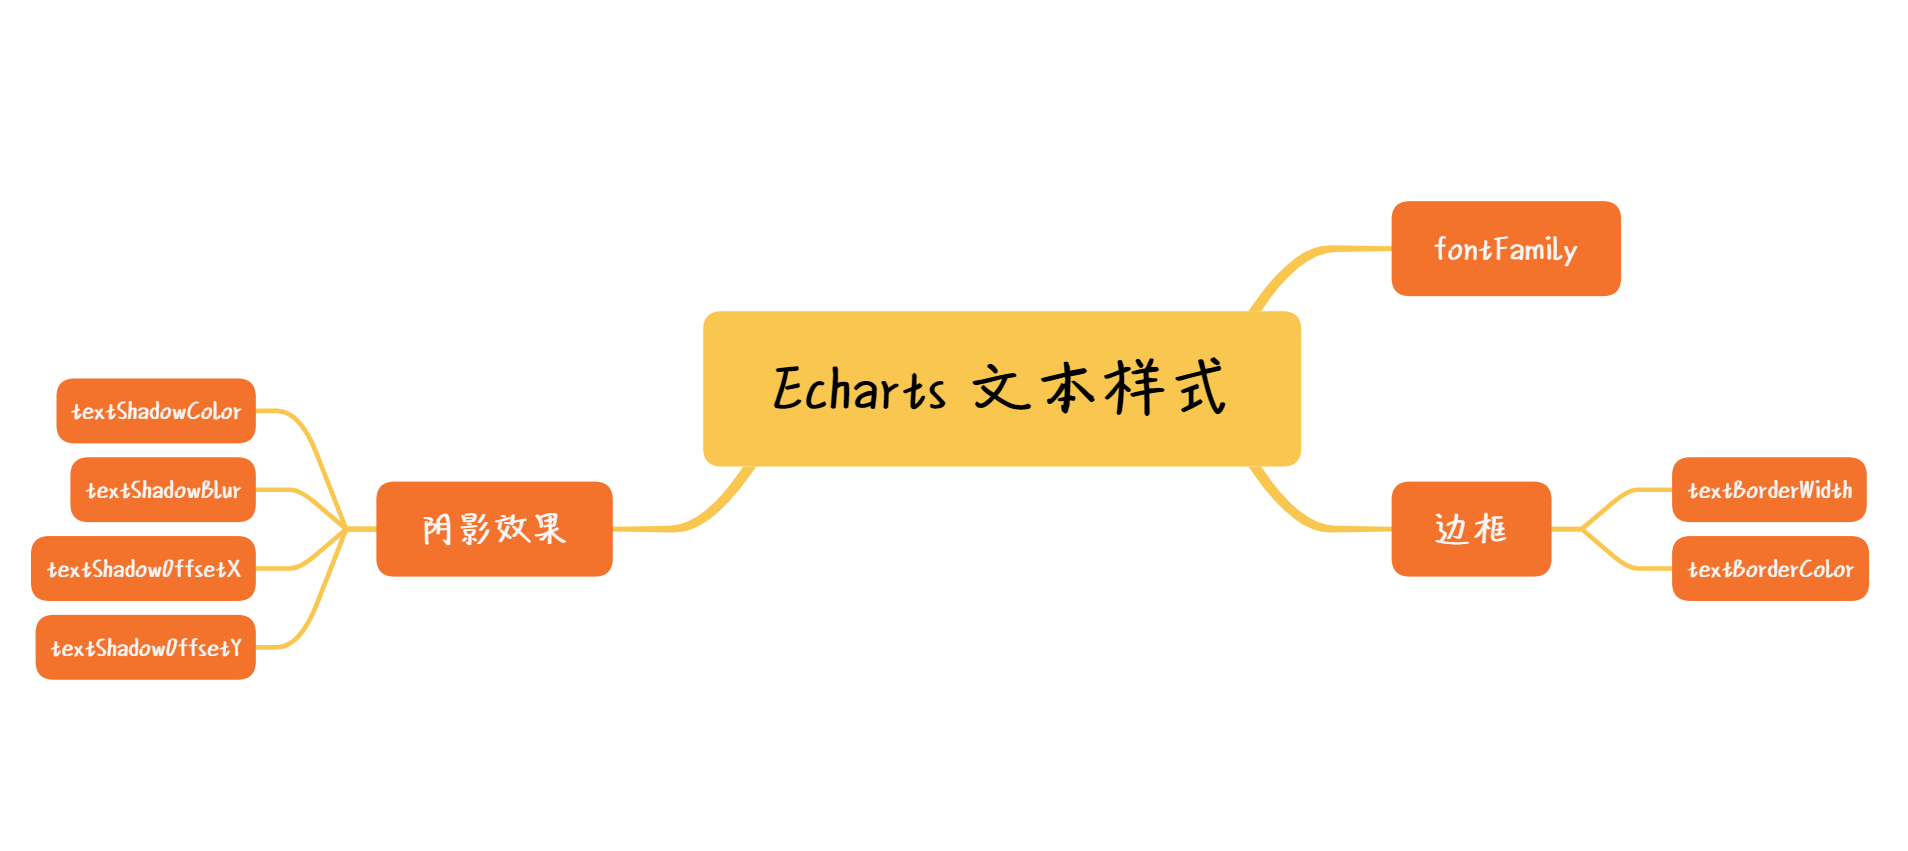
针对文本项,ECharts 提供了一套通用的配置属性,包含:
| 配置名 | 类型 | 默认值 | 说明 |
|---|---|---|---|
| color | string | #333 | 标题文字颜色 |
| fontStyle | string | normal | 标题文字字体风格,可选值: normal、italic、oblique |
| fontWeight | string | number | normal | 标题文字字体粗细度,与 css 的 font-weight 属性类似,可选值:normal、bold、bolder、lighter,或数字 100、 200、 300 等 |
| fontFamily | string | sans-serif | 标题文字字体,与 css 的 font-family 属性类似,可选值:serif、Arial、Microsoft YaHei 等 |
| fontSize | number | 12 | 标题文本大小 |
| lineHeight | number | 文本行高 | |
| width | number | 文本宽度,一般不需要指定 | |
| height | number | 文本高度,一般不需要指定 | |
| textBorderColor | string | transparent | 文本描边颜色,支持如 backgroundColor 颜色值 |
| textBorderWidth | number | 0 | 文本描边宽度 |
| textShadowColor | string | transparent | 文本阴影色 |
| textShadowBlur | number | 0 | 文本阴影长度 |
| textShadowOffsetX | number | 0 | 文本阴影的水平偏移量 |
| textShadowOffsetY | number | 0 | 文本阴影的垂直偏移量 |
3. 示例
3.1 fontFamily 配置
与 CSS 中的 font-family 相似,ECharts 的 fontFamily 属性同样支持浏览器中包含的所有字体类型,也同样可以设置为自定义字体。基于这种能力,可以实现在 ECharts 文本组件上勾画自定义图标,示例:
<!DOCTYPE html>
<html lang="zh-CN">
	<head>
		<meta charset="utf-8" />
		<meta http-equiv="X-UA-Compatible" content="IE=edge" />
		<meta name="viewport" content="width=device-width,initial-scale=1.0" />
		<title>Echarts Example</title>
		<link href="//cdn.bootcss.com/font-awesome/5.11.2/css/all.min.css" rel="stylesheet" />
	</head>
	<body>
		<!-- 强制触发浏览器加载字体文件 -->
		<i class="fa fa-user" style="font-size: 0;"></i>
		<div id="main" style="width: 600px;height: 400px"></div>

		<script src="//cdn.bootcss.com/echarts/4.5.0/echarts.common.js"></script>
		<script type="text/javascript">
			var myChart = echarts.init(document.getElementById('main'));

			var option = {
				toolbox: {
					feature: {
						saveAsImage: {},
					},
				},
				title: {
					// 自定义字体需要使用 unicode 编码格式表示
					// 如本例中的 `uf007`
					text: '字体测试 uf007',
					textStyle: {
						fontSize: 25,
						// 若字体名称中带有空格,需要使用 `"` 包围
						fontFamily: '"Font Awesome 5 Free"',
					},
				},
			};
			// 如果渲染时字体文件还没加载完,自定义字体会被显示为空
			// 所以这里需要加上延迟渲染
			setTimeout(() => {
				myChart.setOption(option);
			}, 0);
		</script>
	</body>
</html>
实例效果:

需要注意几个关键点:
- 对于字体图表,需要使用
unicode格式表示,如上例中的uf007; - 若自定义字体名称带有空格,名称需要使用
"或'包裹起来,如上例的fontFamily: '"Font Awesome 5 Free"; - canvas 中的文本不具备自动刷新的能力,如果在渲染之前字体文件还没加载完成,则无法正确渲染自定义字体内容。所以在上例中,一需要使用
<i class="fa fa-user" style="font-size: 0;"></i>触发浏览器加载字体文件;二需要在调用setOption处使用setTimeout实现延迟渲染。
3.2 文本描边
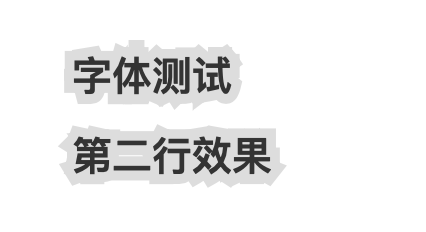
可通过 textBorderColor、textBorderWidth 属性实现文字描边效果,示例:
<!DOCTYPE html>
<html lang="zh-CN">
	<head>
		<meta charset="utf-8" />
		<meta http-equiv="X-UA-Compatible" content="IE=edge" />
		<meta name="viewport" content="width=device-width,initial-scale=1.0" />
		<title>Echarts Example</title>
	</head>
	<body>
		<div id="main" style="width: 600px;height: 400px"></div>

		<script src="//cdn.bootcss.com/echarts/4.5.0/echarts.common.js"></script>
		<script type="text/javascript">
			var myChart = echarts.init(document.getElementById('main'));

			var option = {
				toolbox: {
					feature: {
						saveAsImage: {},
					},
				},
				title: {
					text: '字体测试n第二行效果',
					left: '30%',
					top: '30%',
					textStyle: {
						fontSize: 20,
						textBorderWidth: 10,
						textBorderColor: '#ddd',
						lineHeight: 40,
					},
				},
			};
			// 如果渲染时字体文件还没加载完,自定义字体会被显示为空
			// 所以这里需要加上延迟渲染
			setTimeout(() => {
				myChart.setOption(option);
			}, 0);
		</script>
	</body>
</html>
示例效果:

3.4 阴影效果
与 rect 类型的组件相似,文本组件也支持阴影效果,可通过 textShadowColor、textShadowBlur、textShadowOffsetX、textShadowOffsetY 属性控制,示例:
<!DOCTYPE html>
<html lang="zh-CN">
	<head>
		<meta charset="utf-8" />
		<meta http-equiv="X-UA-Compatible" content="IE=edge" />
		<meta name="viewport" content="width=device-width,initial-scale=1.0" />
		<title>Echarts Example</title>
	</head>
	<body>
		<div id="main" style="width: 600px;height: 400px"></div>

		<script src="//cdn.bootcss.com/echarts/4.5.0/echarts.common.js"></script>
		<script type="text/javascript">
			var myChart = echarts.init(document.getElementById('main'));

			var option = {
				toolbox: {
					feature: {
						saveAsImage: {},
					},
				},
				title: {
					text: 'title shadow 测试',
					left: '30%',
					top: '30%',
					textStyle: {
						fontSize: 25,
						textShadowColor: '#000',
						textShadowBlur: 8,
						textShadowOffsetX: 20,
						textShadowOffsetY: 20,
					},
				},
			};
			myChart.setOption(option);
		</script>
	</body>
</html>
示例效果:

4. 小结

本节主要介绍 ECharts 中各类文本样式的配置方法。文本样式是一种使用广泛,却不难理解的配置,各个项都能在 CSS 上找到对应的概念,所以不必花太多时间学习,需要用到的时候回过头来仔细比对各个配置属性即可。
- 还没有人评论,欢迎说说您的想法!


 客服
客服


